Astropy: WCS Transformations
Documentation
For more information about the features presented below, you can read the astropy.wcs docs.
Data
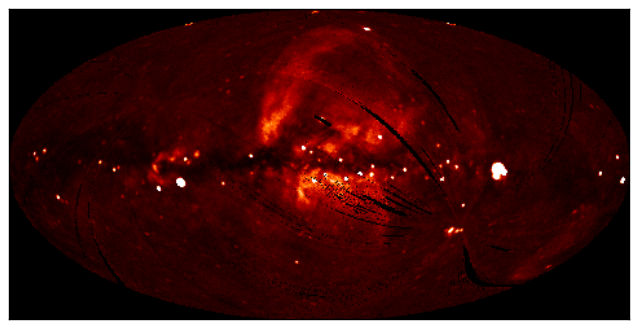
The data used in this page (ROSAT.fits) is a map of the Soft X-ray Diffuse Background from the ROSAT XRT/PSPC in the 3/4 keV band, in an Aitoff projection:
Representing WCS transformations
The World Coordinate System standard is often used in FITS files in order to describe the conversion from pixel to world (e.g. equatorial, galactic, etc.) coordinates. Given a FITS file with WCS information, such as data/ROSAT.fits, we can create an object to represent the WCS transformation either by directly supplying the filename:
from astropy.wcs import WCS
w = WCS('data/ROSAT.fits')
or by passing a Header object:
from astropy.io import fits
from astropy.wcs import WCS
header = fits.getheader('data/ROSAT.fits')
w = WCS(header)
Pixel to World and World to Pixel transformations
Once the WCS object has been created, you can use the following methods to convert pixel to world coordinates:
wx, wy = w.wcs_pix2world(250., 100., 1)
print(wx, wy)
This converts the pixel coordinates (250, 100) to the native world coordinate system of the transformation. Note the third argument, set to 1, which indicates whether the pixel coordinates should be treated as starting from (1, 1) (as FITS files do) or from (0, 0). Converting from world to pixel coordinates is similar:
px, py = w.wcs_world2pix(0., 0., 1)
print(px, py)
Working with arrays
import numpy as np
px = np.linspace(200., 300., 10)
py = np.repeat(100., 10)
wx, wy = w.wcs_pix2world(px, py, 1)
print(wx)
print(wy)
Practical Exercises
Level 1
Try converting more values from pixel to world coordinates, and try converting these back to pixel coordinates. Do the results agree with the original pixel coordinates? Also, what are the world coordinates of the pixel at (1, 1), and why?
# Your solution here
Level 2
Extract and print out the values in the ROSAT map at the position of the LAT Point Sources from the catalog in data/gll_psc_v08.fit (using the columns GLAT and GLON)
# Your solution here
Level 3
Make a Matplotlib plot of the image showing gridlines for longitude and latitude overlaid (e.g. every 30 degrees).
# Your solution here